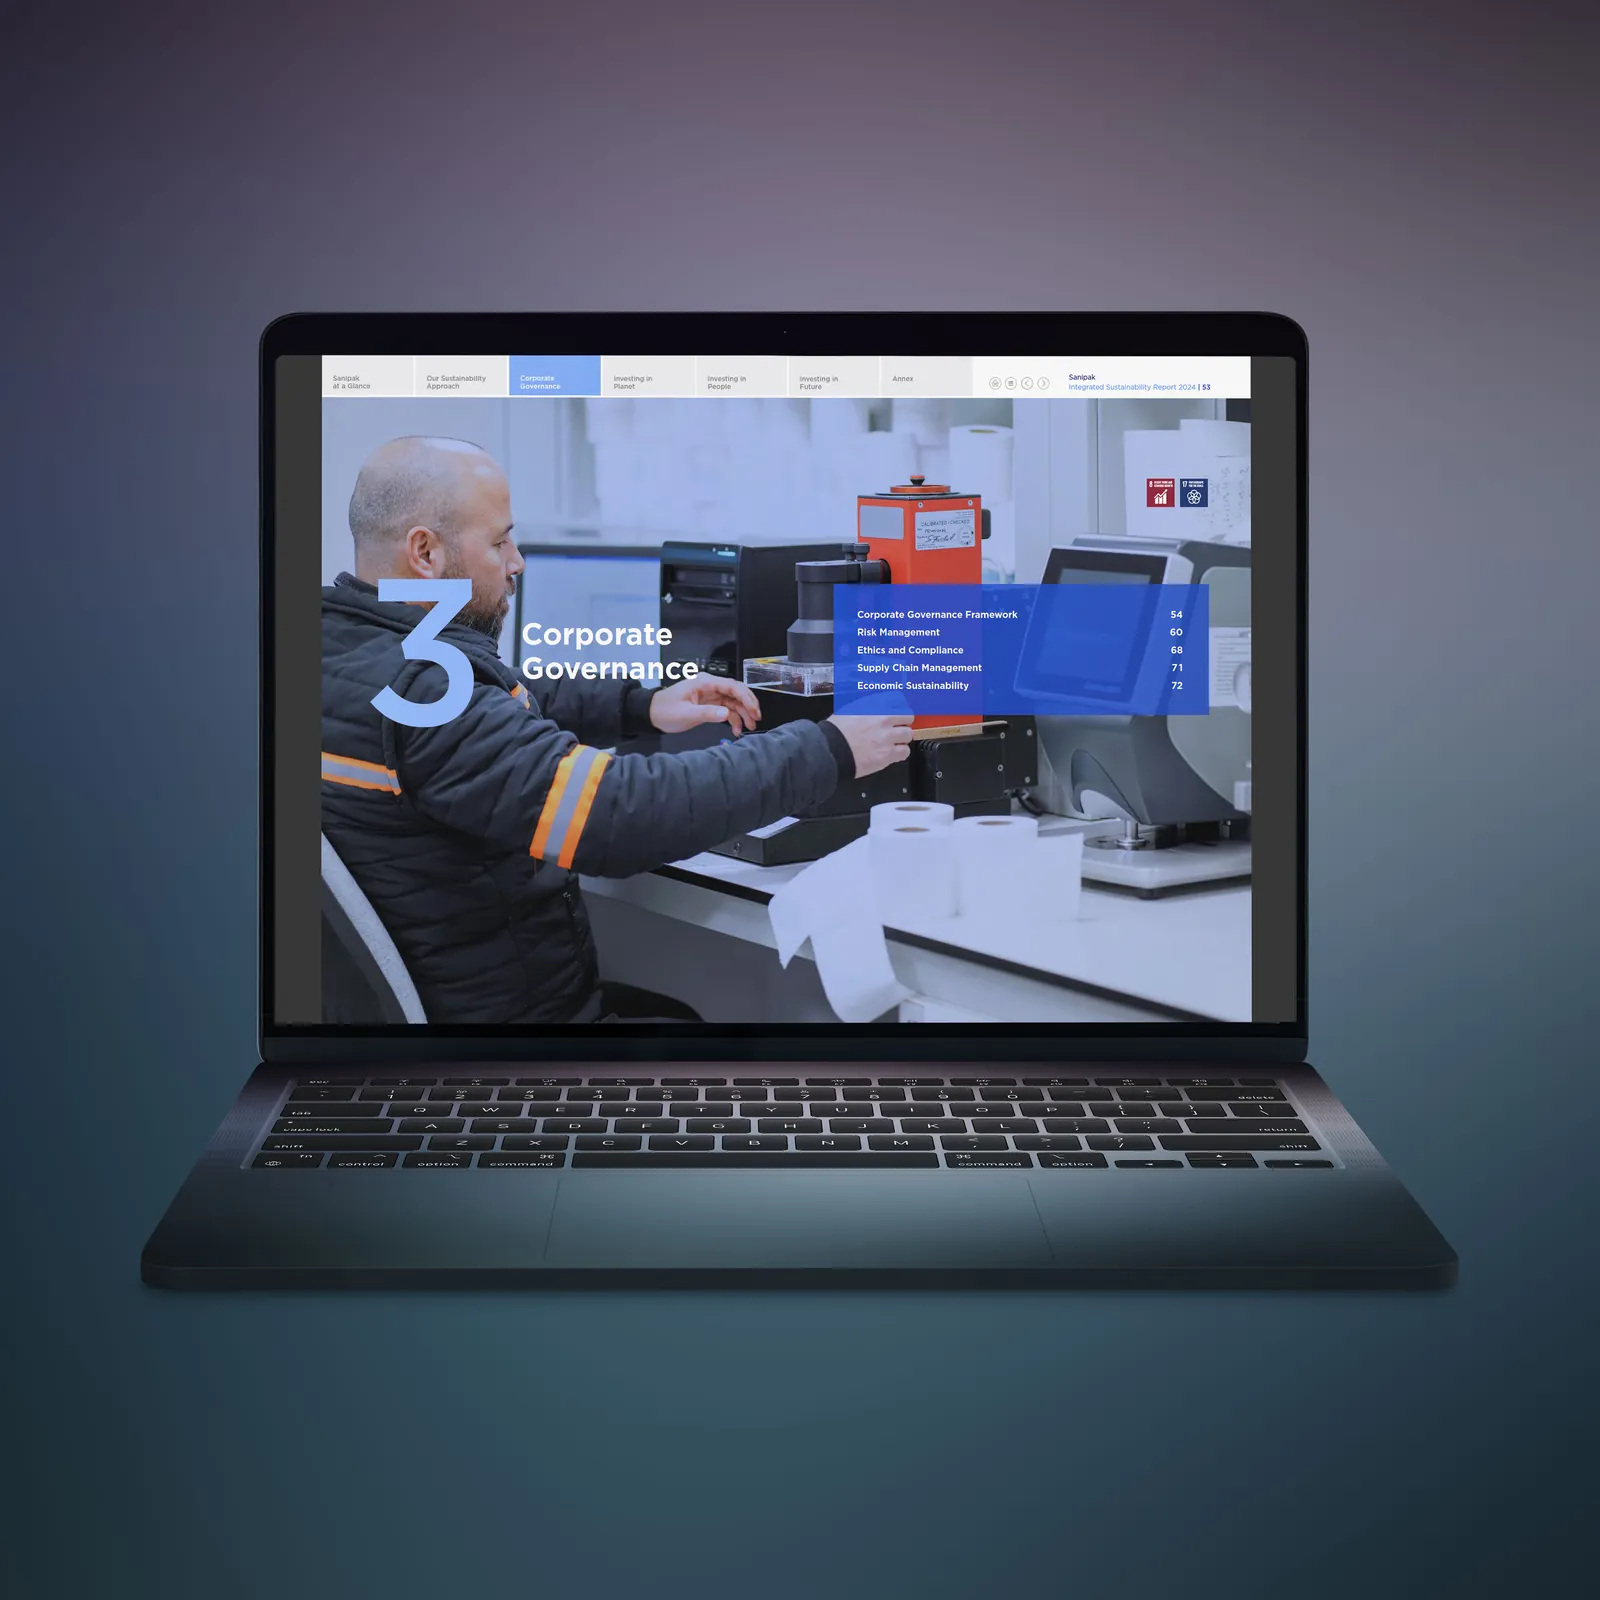
We design annual and sustainability reports.

We turn GRI, TSRS, IFRS S1/S2 and ESRS content into clear report design, from first concept to print and interactive PDF.

New: we also turn your published report PDF into an interactive microsite.

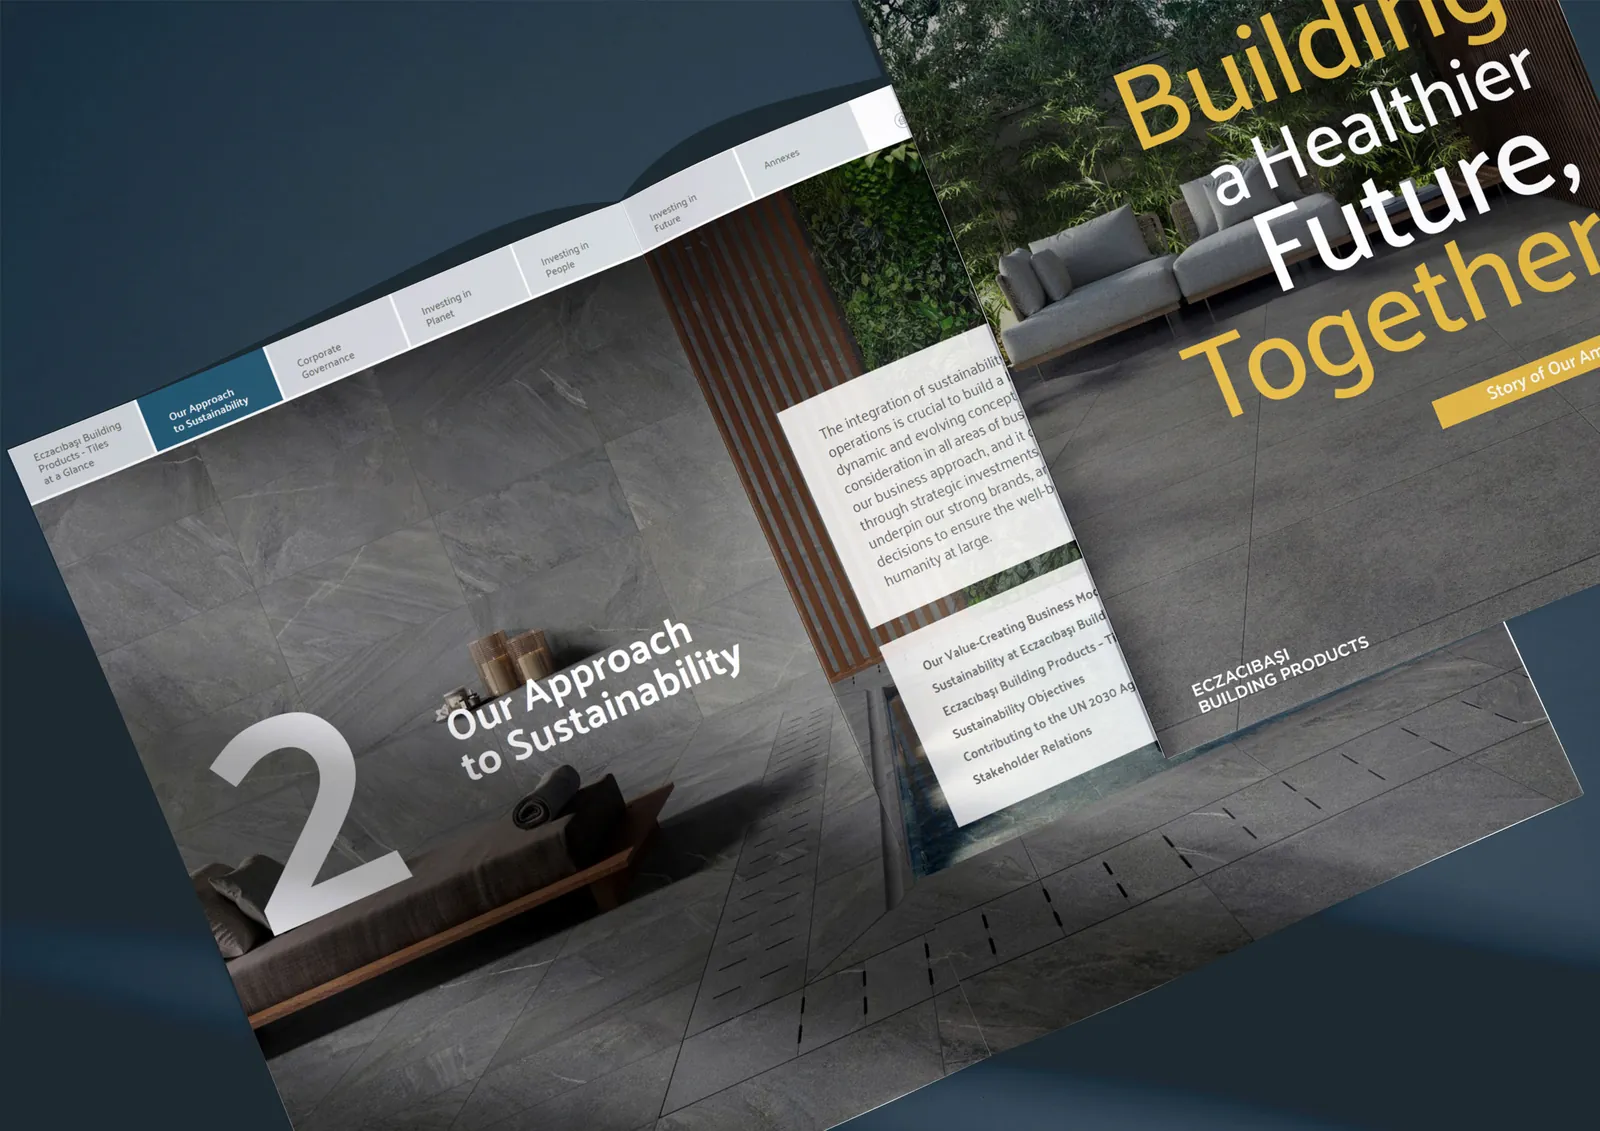
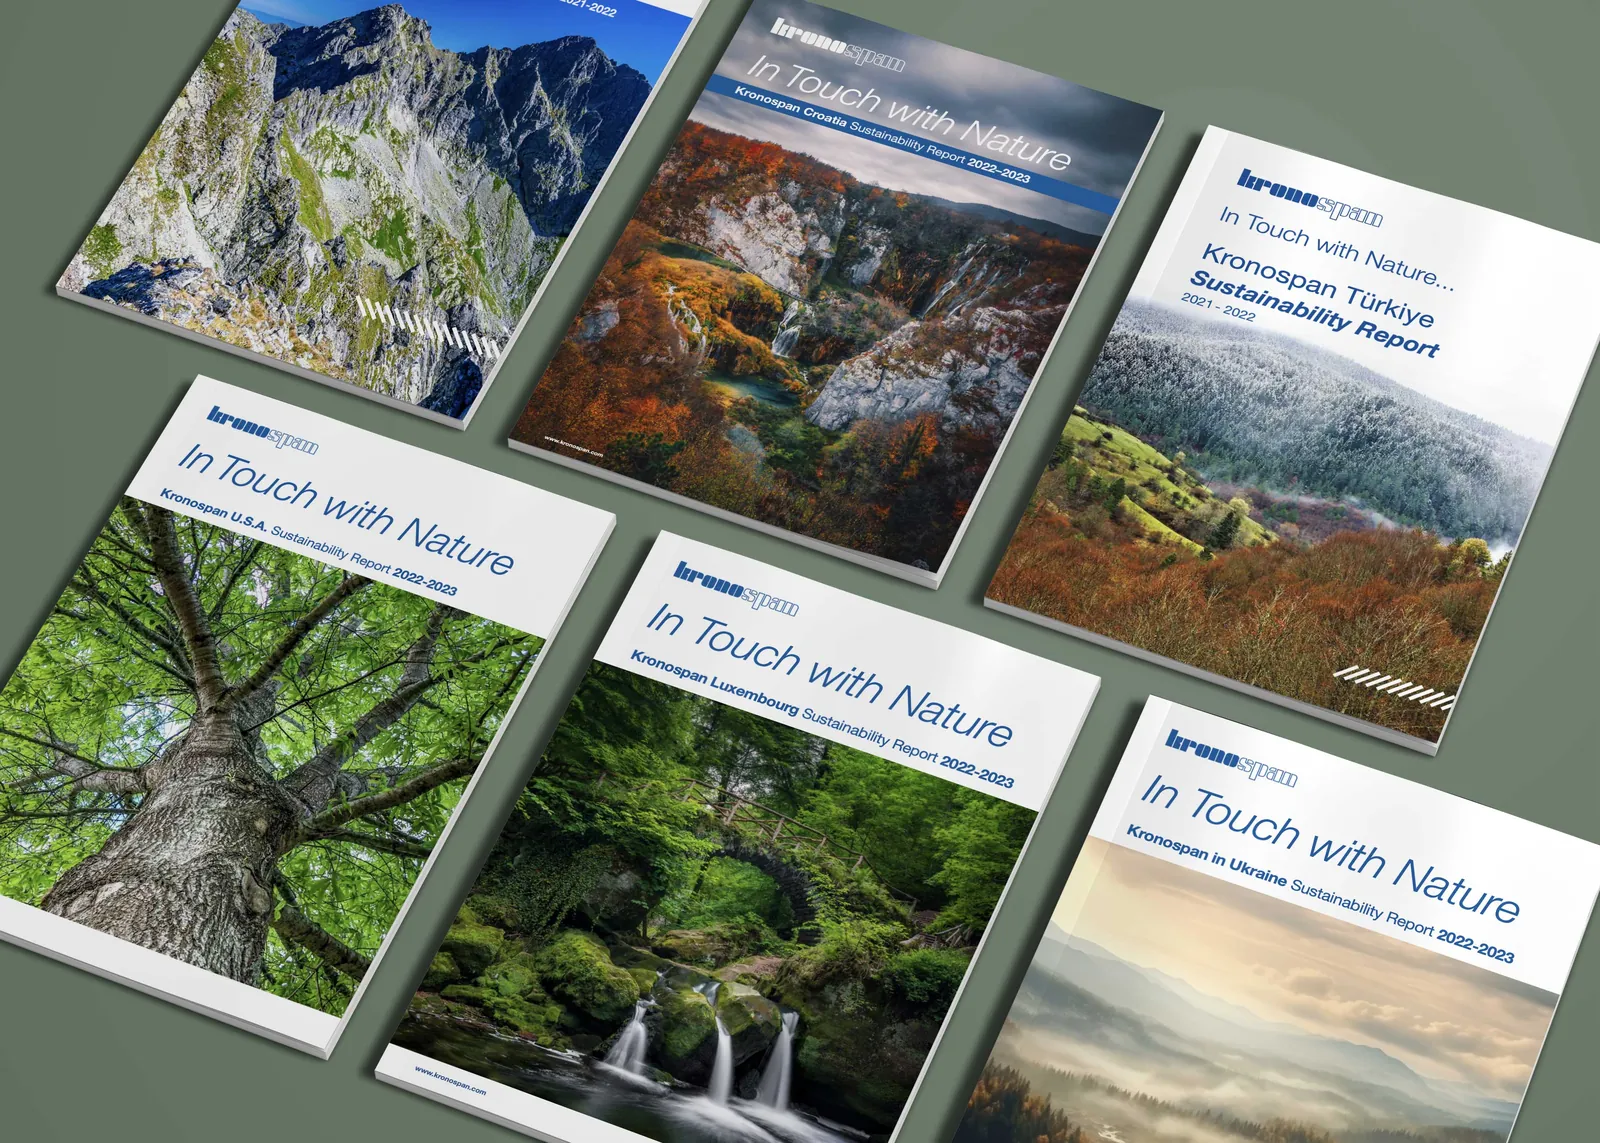
KronospanSustainability Reports

References

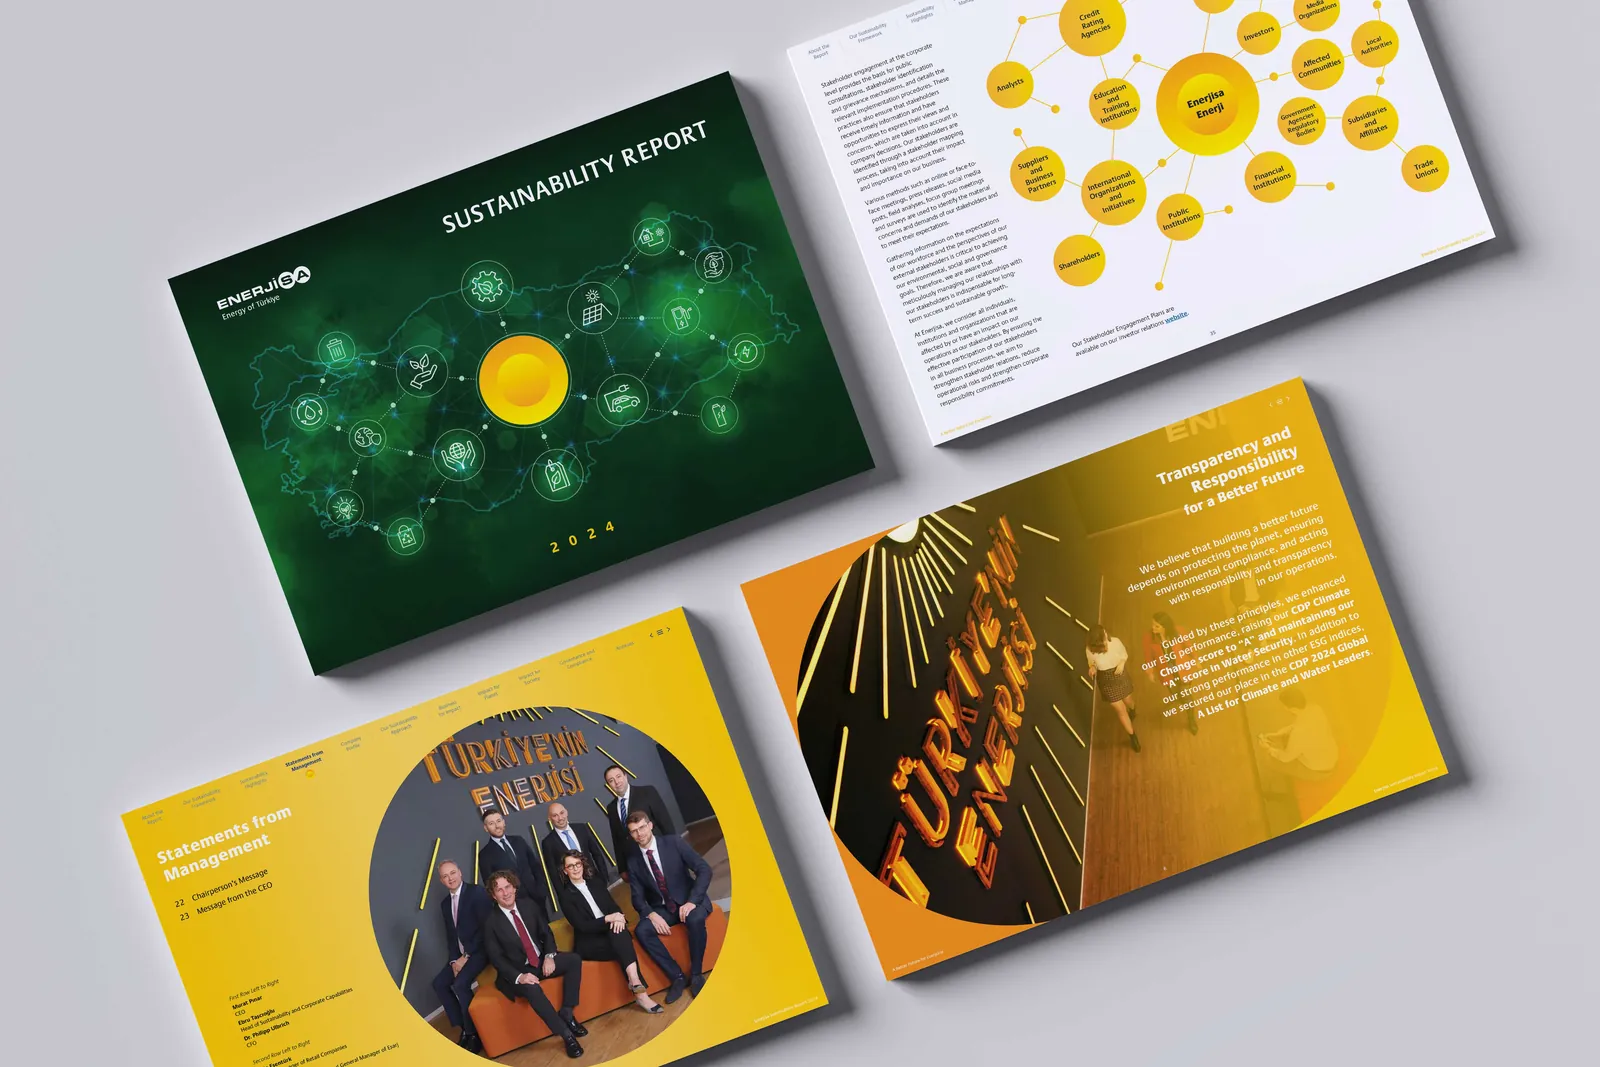
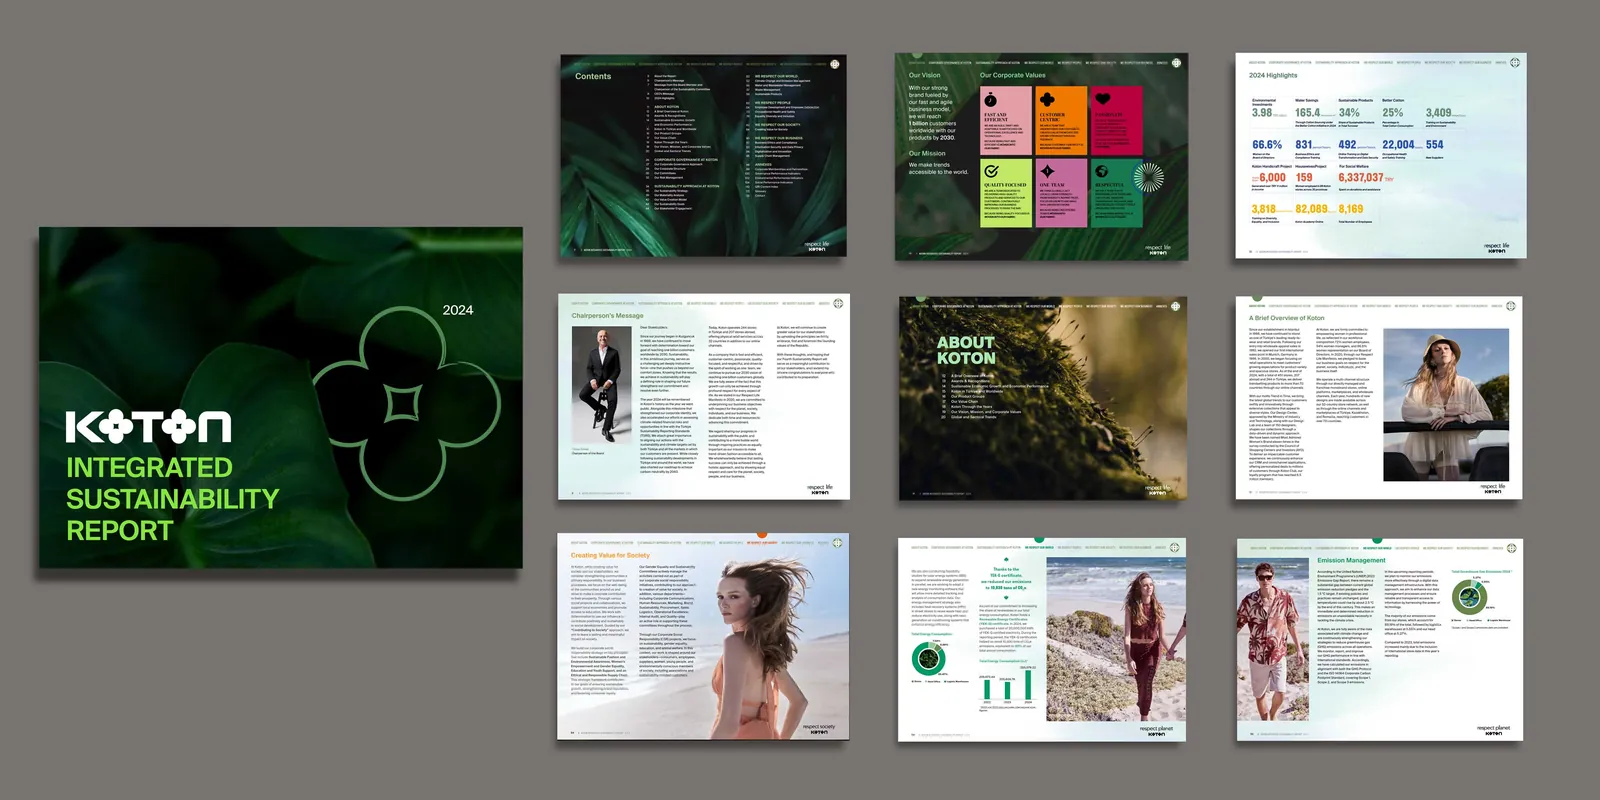
Annual, integrated and sustainability reports from our studio, for groups such as Kronospan, Eczacıbaşı, Akbank and Enerjisa. Designed from first concept to print and interactive PDF.

All work →
01

Kronospan

Sustainability Reports
02 · 2024

Eczacıbaşı Group + Subsidiaries

Integrated Sustainability Report design
03 · 2025

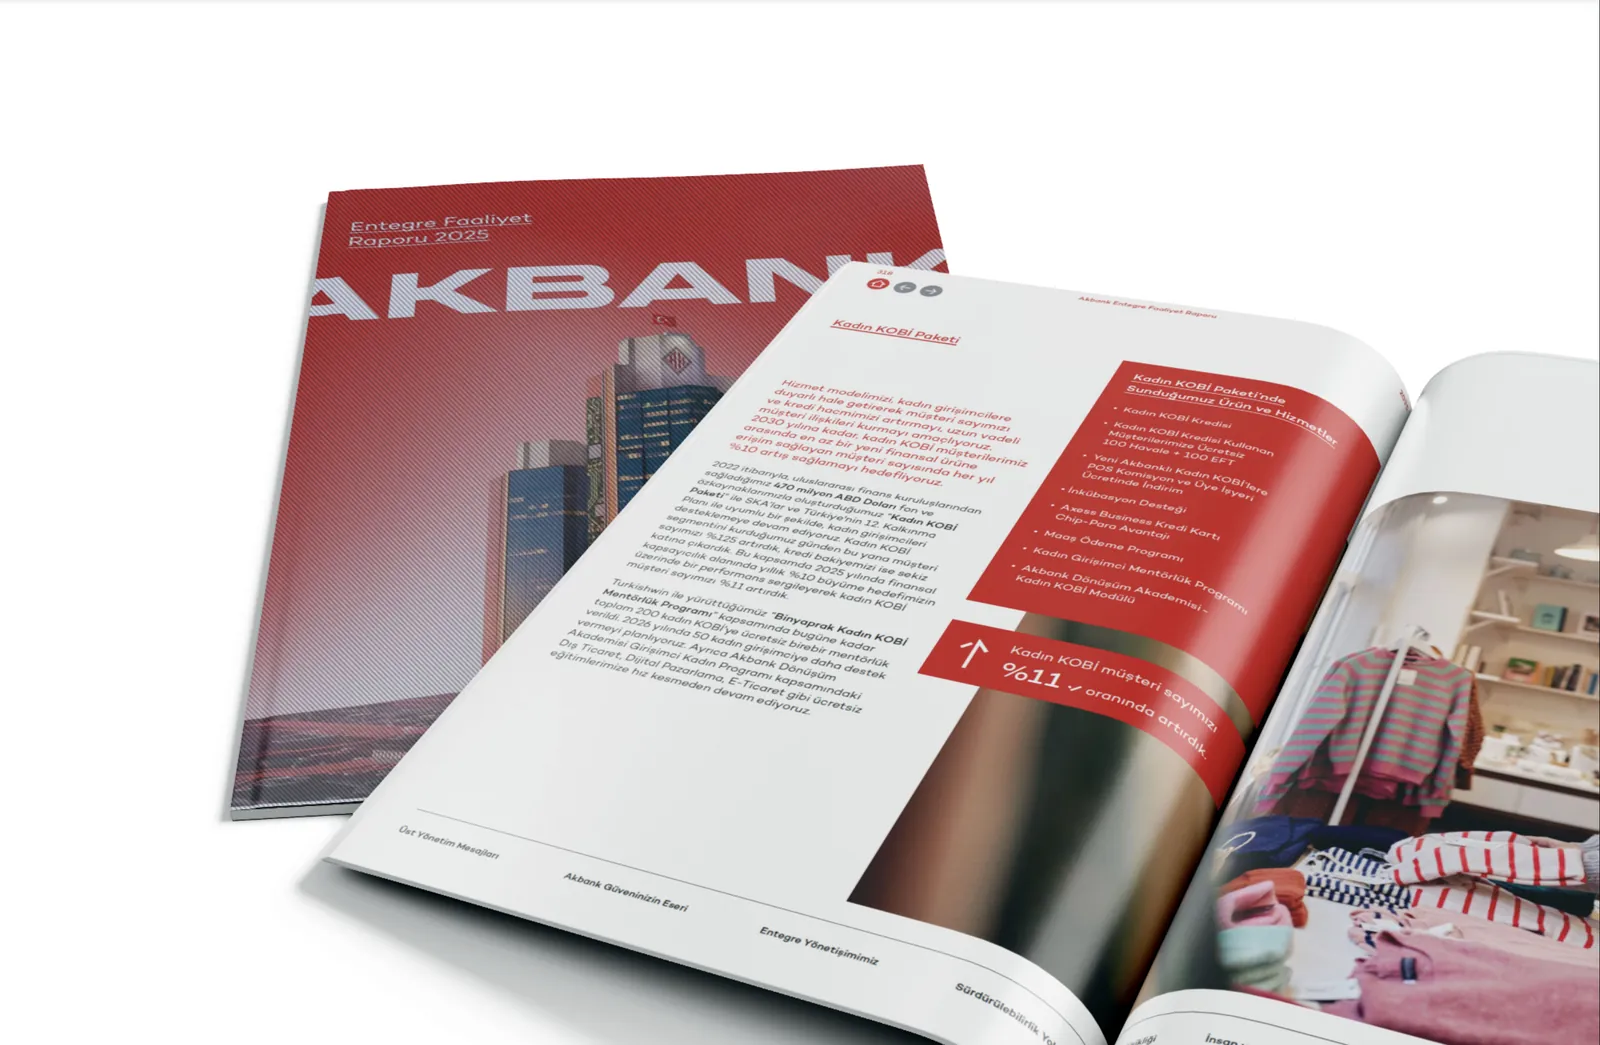
Akbank

Integrated Annual Report
Clients
  • Kronospan
  • Eczacıbaşı
  • Akbank
  • Enerjisa
  • Koton
  • Sanipak
  • Yataş
  • VitrA
  • Limak
  • Esan
  • ECCM Bank
  • Doğuş Holding
  • Çalık Holding
  • Özyeğin University
Our core service

Report design

For listed and private companies, holdings and group companies

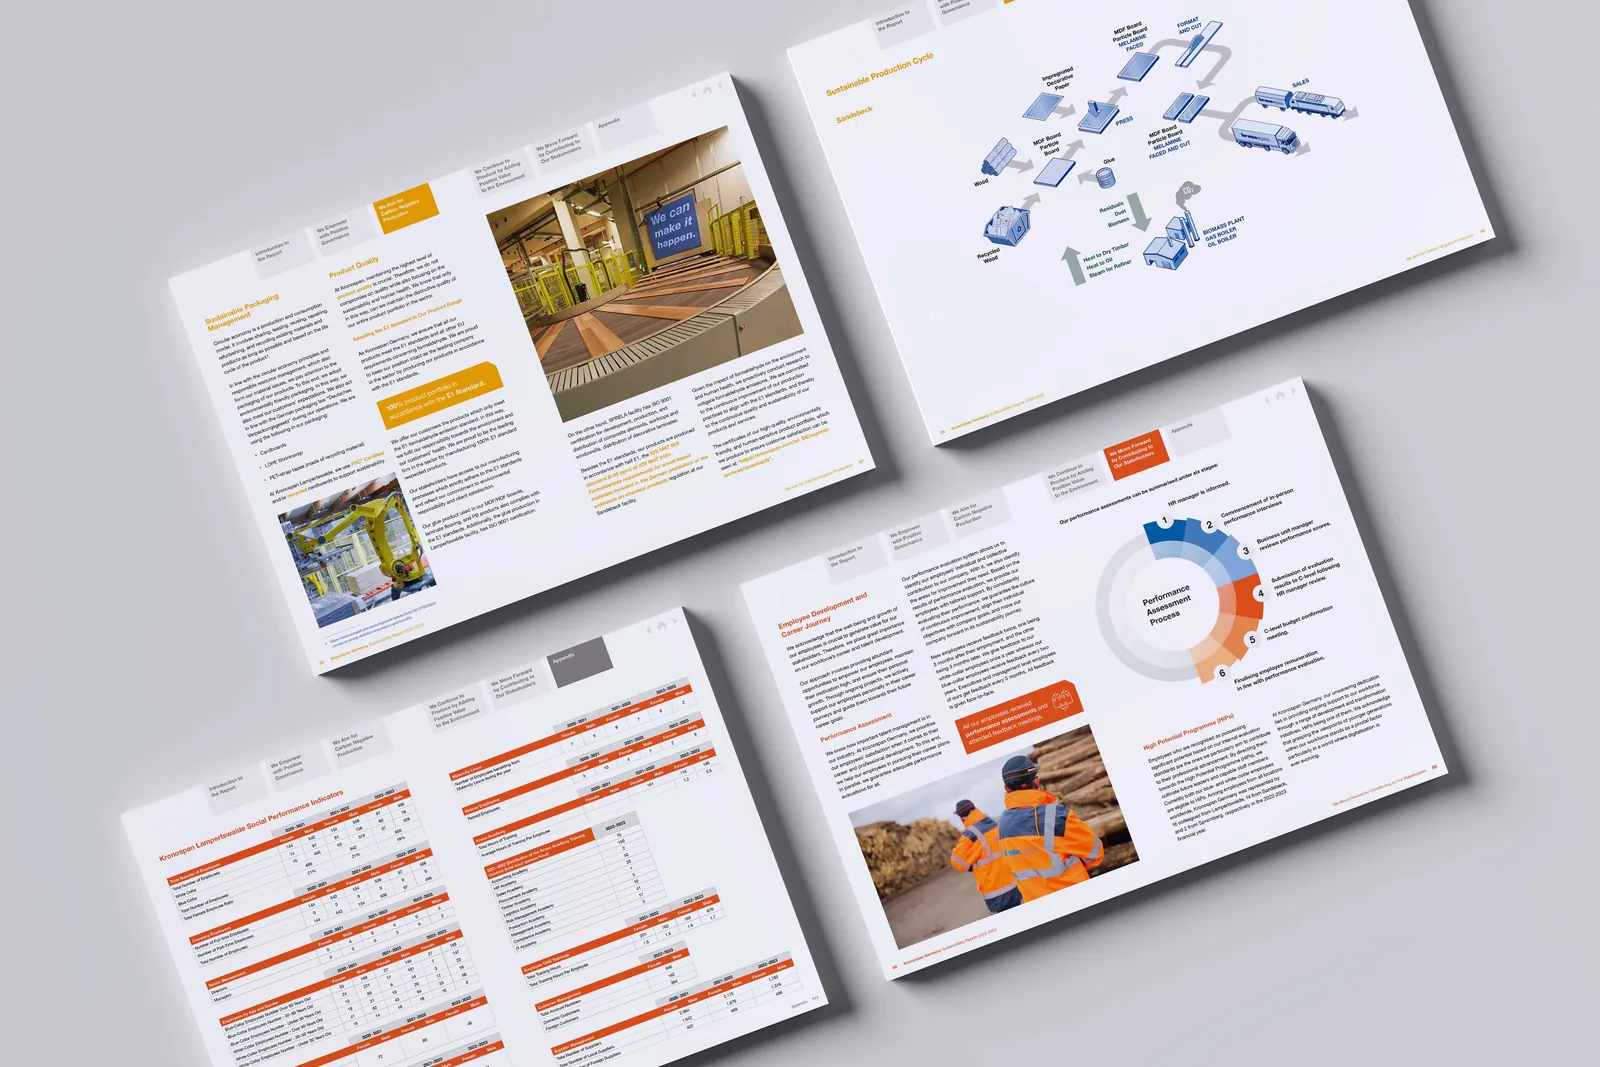
We design your annual, integrated or sustainability report, from content structure to print and interactive PDF. GRI, TSRS, IFRS S1/S2 and ESRS content becomes a clear system in your brand's visual language.

  • Content structurechapter architecture, page flow and reading hierarchy.
  • Data visualisationtables, charts and infographics built from your figures.
  • Print and interactive PDFprint⁠-⁠ready files and a linked, navigable PDF.
  • LanguagesTurkish, English and Arabic editions.
  • Closed⁠-⁠circuit production: drafts are never uploaded to the cloud
  • Written proposal and company invoice
NewFrom published PDF to an interactive investor microsite

Your published PDF as an interactive investor microsite.

  • Real, searchable text
  • Readable by search engines and AI
  • PDFs in any language, 8-language interface
Explore the live sample microsite
Sustainability report PDF shown on the web with its original design, contents and search
Before and after

The same report, two readings

Before · static PDF

220 pages, one language, figures locked in the layout

  • Search by page, not by topic
  • Charts are pictures: no data, no filters
  • One edition, one language

After · live investor microsite

  • Dynamic tables
  • Chart builder
  • AI summary
  • 60-second audio summary
Open full screen →

Pick a style: the same figures, read four ways

Reports on the web

A PDF gets read. A web page gets found.

Readable by AI and search

Real text, headings and tables, so AI assistants quote figures straight from your report.

Where the EU is heading: ESEF / ESAP

CSRD statements are filed as XHTML (ESEF); from 2027, ESAP collects company data machine⁠-⁠readable.

One link instead of a 20 MB attachment

Phone⁠-⁠friendly and screen⁠-⁠reader ready; one link replaces a 20 MB email attachment.

A microsite does not replace the legal filing format. It makes your report easier to find and read.

Corporate PDF → interactive investor microsite · 100–⁠300+ pages

Live Studio Microsite Examples

Sample microsites that show our studio's design directions. The companies are fictional and the figures are sample data. Open one and scroll: your published report can read like this.

Show 8 more examples

The studio directions use fictional companies; the holding example uses sample data.

Enterprise turnkey deployment

Every reporting year in one verified microsite. Nothing to integrate.

For holdings, listed groups and their advisers. We build the microsite from your published reports, check every figure against its source page and hand over a static package for your own domain. Three things set it apart from a PDF archive.

01 · Multi⁠-⁠year CSR memory

One microsite for every reporting year

Successive reports, for example 2023, 2024 and 2025, sit in one microsite with a year switcher. Readers compare years without opening three PDFs. Each new report adds a year; earlier years stay online and unchanged.

  • Year switcher and year⁠-⁠on⁠-⁠year comparison
  • Source tag on every figure: report, year and PDF page
  • Each new report adds a year to the same address
02 · AI shield and scope notes

Search engines and AI assistants read the verified figures

Each microsite publishes an llms.txt summary and schema.org JSON⁠-⁠LD built only from figures checked against the reports, with a version fingerprint (SHA-256). Where a methodology or reporting scope changed between years, a scope note sits next to the figure, so an analyst or an AI tool reads the reason instead of taking the difference for an error.

  • llms.txt in each report language
  • Verified JSON⁠-⁠LD and a downloadable data file
  • Scope notes where the basis of a figure changed
03 · Zero IT load

100% static files, reviewed by IT in about 10 minutes

The delivered microsite is plain HTML, CSS, JavaScript and data files. It needs no database, no server⁠-⁠side code, no ERP or system connection and no user accounts, and it sets no tracking or third⁠-⁠party cookies. It runs on your own domain (CNAME) or on⁠-⁠premise server.

  • No database, no server⁠-⁠side code
  • No ERP or system connection, no logins
  • Zero tracking or third⁠-⁠party cookies
Partnership

White⁠-⁠label production partnership

You complete the report content and the PDF design; we handle the digital production in the background. Offer your clients turnkey interactive reporting under your own brand.

Contact us about the partnership model
Heritage and discipline

A design studio for 25 years. Sustainability reports for the last 6.

Loop Reports comes from a studio with 25 years in corporate reporting, visual design and film production. Its design discipline was built in corporate reporting projects carried out with Big Four audit teams and in the annual report processes of large holdings. For the past 6 years the studio has specialised in digital ESG, GRI, TSRS and SDG reporting.

25 years
of corporate reporting, visual design and film production
6 years
of digital ESG, GRI, TSRS and SDG reporting
Questions

Questions from IT, procurement and reporting teams

What exactly do we receive?

A static microsite package (HTML, CSS, JavaScript, JSON data, images and the report PDFs), the llms.txt files and the verified data file. You host it on your own domain or server, or we host it for you.

Does it connect to our ERP, SAP or reporting platform?

No. We work from your published report PDFs and, if you wish, from Excel or CSV exports. Nothing connects to your systems, so there is no integration project and no system access to grant.

Which of our data leaves the company?

For a microsite: only reports that are already published. For report design: your unpublished content is processed on our studio computers in a closed circuit and is not uploaded to cloud services.

How are the figures checked?

Each figure is taken word for word from the report and tagged with its file and page. A second person checks every figure against the PDF before delivery. Nothing is added that the reports do not contain, and nothing is rounded.

What happens when next year's report is published?

The new year is added to the same microsite. Earlier years stay online, and where the basis of a figure changed, a scope note explains it.

How long does a project take?

It depends on page count, languages and the number of years. Send the links to your published reports and you receive a firm quote and timeline within 2 working days.
Talk to us about your next report

Get a proposal